Figure 1
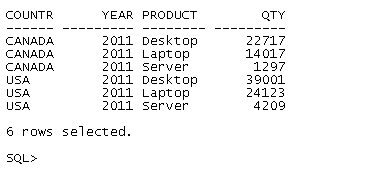
| The data shown is a sample of sales data (quantity values used for reference). Shown in figure 1 is the summary data. As an example, the desktop quantity data is a sum of desktop and server quantities. By using SQL modeling, it can be revised by applying rules in the final reporting data as shown in output Figure 2. The data in the example below is setup as a query table and can be copy-pasted on any Oracle sql tool such as Oracle's SQL*Plus to see the results. |
Figure 1 |
| SELECT country_cd, year, product, qty FROM |
| (SELECT 'CANADA' as country_cd, 2011 as year, 'Laptop' as product, 14017 as qty FROM DUAL UNION |
| SELECT 'CANADA' as country_cd, 2011 as year, 'Desktop ' as product, 22717 as qty FROM DUAL UNION |
| SELECT 'CANADA' as country_cd, 2011 as year, 'Server' as product, 1297 as qty FROM DUAL UNION |
| SELECT 'USA' as country_cd, 2011 as year, 'Laptop' as product, 24123 as qty FROM DUAL UNION |
| SELECT 'USA' as country_cd, 2011 as year, 'Desktop ' as product, 39001 as qty FROM DUAL UNION |
| SELECT 'USA' as country_cd, 2011 as year, 'Server' as product, 4209 as qty FROM DUAL) qt_data |
| MODEL |
| PARTITION BY (qt_data.country_cd) |
| DIMENSION BY (qt_data.product, qt_data.year) |
| MEASURES (qt_data.qty) |
| RULES (qty['Desktop ', 2011] = qty['Desktop ', 2011] - qty['Server',2011], |
| qty['TotalQTy', 2011] = qty['Desktop ', 2011] + qty['Laptop',2011] + qty['Server',2011]) |
| ORDER BY country_cd, product, year; |
| The rule used is desktop quantity = desktop quantity - server quantity. The next rule is the summation of the three quantities after applying the first rule. The output is as shown in Figure 2. Complex data warehouse BI analysis and reporting can be performed by applying various rules that is specific to business/corporation. The other rule shown is iterative analysis in factorial computation. |
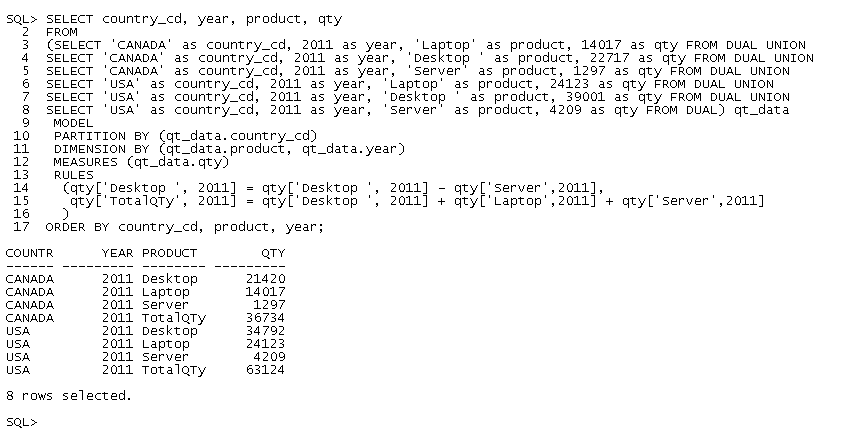
Figure 2 |
74011