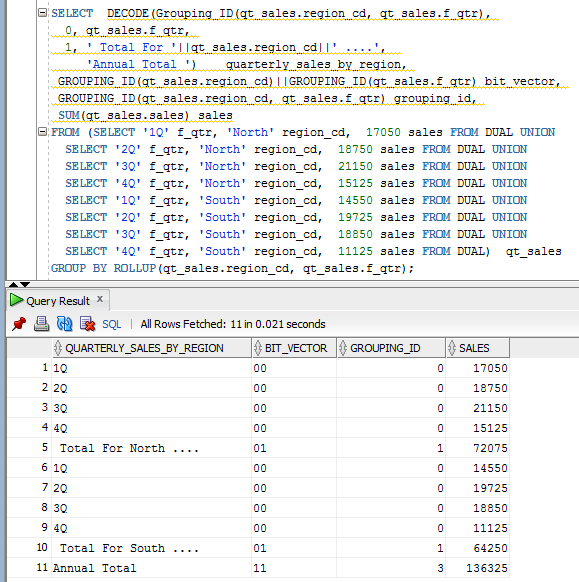
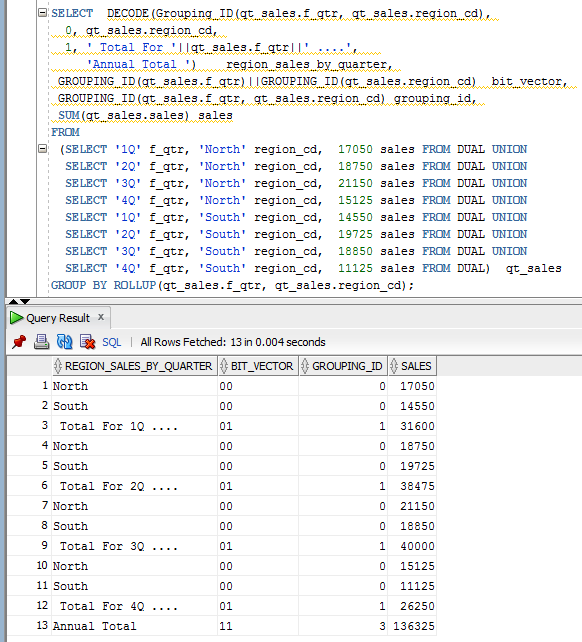
The query below shows the "Regional Sales Summary By Quarter"
as specified in the ROLLUP(qt_sales.region_cd, qt_sales.f_qtr).
The above query can be changed to "Quarterly Sales Summary By
Region" by changing the order of columns in the rollup as
specified in the ROLLUP(qt_sales.f_qtr, qt_sales.region_cd)
condition. The bit vector and grouping_id computation are
based on the rollup condition as shown in output diagram.
By using DECODE() on grouping_id and using report specific columns
for appropriate values of grouping_id (0,1,.. etc.), the query can
be converted into a report as shown in query below.
Using similar GROUPING_ID and ROLLUP logic, reports can be easily
created for several summary levels. It is essential to know the
increasing value of GROUPING_ID with more columns used in the
group by clause. The maximum value (bit vector) of Grouping_ID
can be computed as 2n-1, where n is the number of
columns that are being grouped in the query (in the above
example it is 22-1 = 3 and for
3 columns
it is 7
and so on).